
HOW “IMMACULATE” IS CANADA’S DISINFLATION?

Jennifer Robson
Back in November, the Council of Economic Advisors to the U.S. President put out a briefing note on disinflation – that is when the rate of inflation (or the rate at which prices are increasing month-over-month and year-over-year) slows down. When inflation cools (though ideally without heading into deflation), we often see an increase in unemployment. But, as the CEA note observed, the U.S. has seen substantial disinflation while maintaining a 50-year record low and steady unemployment level. “This much disinflation without a substantial rise in unemployment,” says the briefing note, “contradicts the conventional economic rule-of-thumb that it takes much more labor market slackening than we’ve seen to get inflation down this much.” At the end of December, the Financial Times ran an article noting that this “immaculate disinflation” was widespread in much of the world.
Here in Canada, inflation has also come down and unemployment has remained remarkably low. The table below shows the side-by-side comparison of the U.S. (taken from the CEA note above) and Canadian trends. No, the measures of CPI and unemployment are not perfectly comparable across countries. The point is the relative changes over the same period within each country. That data suggests basically the same headline story of “immaculate disinflation” in both countries.
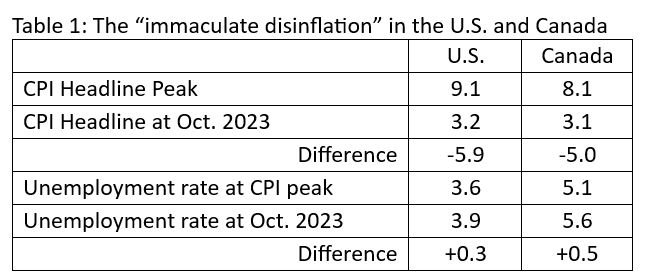
Sources: White House Council of Economic Advisors, Bank of Canada, Statistics Canada Table 14-10-0380-01.
For now, both countries’ central banks are holding the line on interest rates, as expected. As ever, analysts and watchers are parsing the language in the banks’ public statements. Here in Canada, the Bank feels that, while pricing behavior of firms has normalized, it is keeping an eye on household spending (expected to rise in the second half of 2024), inflation expectations (which have become a bit disconnected from other indicators), and wage growth (likely higher than where the Bank would prefer to see it).
Sidebar: The Bank uses a few different indicators to track wages: payroll data from employers (Survey of Employment, Payrolls and Hours), survey data from workers (Labour Force Survey), the Productivity Accounts (estimating all payments for work, including self-employment), and the National Accounts data (tracking wages and salaries paid). Then it combines these into an indicator it calls “the wage-common”, to get a sense of the underlying pressures on wages in Canada. And yes, these indicators are tracking at between 3% and 5%, but they’ve been pretty flat since the start of 2021. This is a little higher than the pre-pandemic (2016 to 2019) of between 0% and 3%.
But, if we only look at the topline indicators on household spending, wages and so forth, the Bank and policymakers could be overlooking important differences in the trends between different groups of households. In short, what looks like a mostly “immaculate” disinflation at the aggregate level, might actually be pretty messy, depending on where your household sits.
In the United States, Claudia Sahm has made a compelling case that, despite inflation, and notwithstanding some negative vibes, most American households are better off today than they were before the pandemic. Sahm finds that wages have risen, especially for lower income Americans. American consumer spending is back on track and more Americans, including those in lower income levels, now have a nest egg. That is, they have higher wealth to draw on, whether as insurance against some other shock to their bank account, or to build assets to invest in productive uses.
Is the same redistribution story true here in Canada? Let’s find out!
I’ll begin with data from the Bank of Canada’s quarterly Canadian Survey of Consumer Expectations. Yes, there is evidence that Canadian consumers may share some of the bad vibes of their southern neighbors. The chart below illustrates the change over time, since the start of 2019, between low, middle, and higher- income households in their own perceived risk that they could lose their job.

Data source: Bank of Canada, Canadian Survey of Consumer Expectations
While middle income Canadians experienced some heightened anxiety during the worst of the COVID-19 pandemic, their confidence they will keep their job is returning to something closer to pre-pandemic levels. Upper income workers, meanwhile, just keep paddling along, insulated, and confident. However, perceived risk among lower income workers has continued to rise and now really diverges from other income groups. Maybe these vibes don’t reflect the overall strength of the Canadian labour market, but lower income workers also know that they’re always most at risk of being laid off, especially if the market softens.
Next, I’m turning to a still new but, I think, very promising set of data from Statistics Canada: data on household finances from the National Economic Accounts. Data nerds can read all about the modelling behind it from Statistics Canada. Annual estimates are available for 2019 through 2022, but for only three quarters in 2023. I’ve projected the final 2023 data under the assumption that the final quarter remains consistent with the year-to-date trend. Note, the unemployment rate was largely unchanged (from 5.7% to 5.8%) so I feel reasonably comfortable with this approach, but others may disagree. In the charts below, I show the relative change from 2019 to 2022 and then the projected change from 2022 to 2023 in a few key indicators of household finances. These are reported by household income quintile, that is five equal-sized groups, ordered from poorest to richest.
The next chart shows what’s been happening to disposable household income, that is, income from all sources after taxes and other mandatory payments.
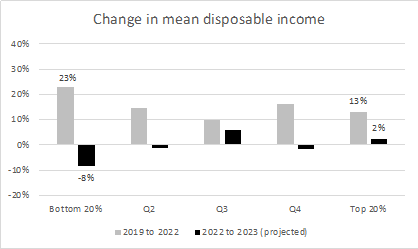
Source: Author’s calculations using Statistics Canada Tables 36-10-0587-01 and 36-10-0662-01
During the pandemic, the incomes of the poorest 20% of households increased significantly – through the combined impact of wage top-ups, top-ups to existing benefits, easier access to Employment Insurance, temporary income support programs, and suspension of some benefit claw-backs. But that’s all over now and in the last year, their disposable incomes have fallen by 8%.
It’s also noteworthy that the net change to household incomes, from 2019 to the end of 2023, across all income groups is remarkably even at between 13% and 16%. That’s not surprising. Temporary pandemic relief was not generally designed to change the overall income distribution in Canada and the largest programs (emergency and recovery benefits) were widely available and used across different levels of household income.
In the next two charts, this net change in disposable income is split into two key income sources: cash transfers and compensation for work. It's important to note that the cash transfers in this data look at all transfers of money (not in-kind) from either the private or public sectors to households. For example, if you got a refund or store credit, that would count here. But we can safely assume that the bulk of the transfers is not big swing in store refunds, but instead the ramping up and down of temporary income support programs.
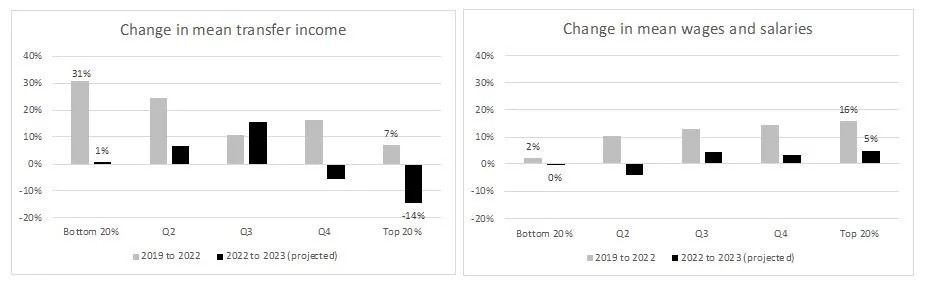
Source: Author’s calculations using Statistics Canada Tables 36-10-0587-01 and 36-10-0662-01
Compared to the top-line story on disposable income, here we see some real divergence in the experiences of lower and higher income households. Transfer income temporarily boosted the incomes of households across the income scale during the pandemic, but especially for the bottom 40%. When programs were cancelled and repayment orders resumed, wages didn’t pick up for the lowest income households. Instead, wage growth has been strongest for the richest households, at a cumulative 21% today compared to 2019. The bottom 20% have not seen wages grow, really at all. I think this suggests that the central bank’s preoccupation with wage growth is not necessarily wrong, but it isn’t able to distinguish between the dynamics facing higher versus lower income workers.
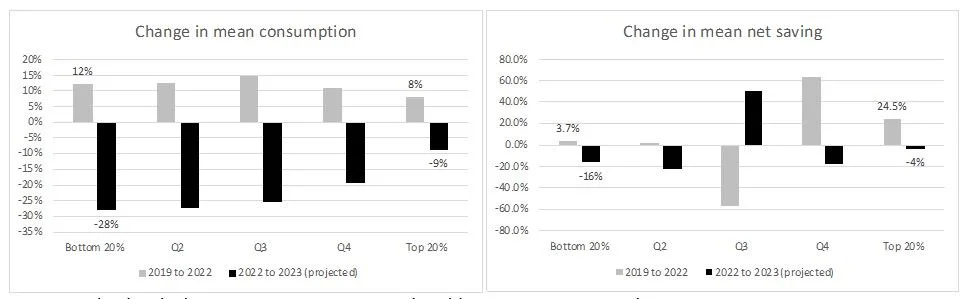
Consumer spending in Canada normally accounts for about 2/3 of GDP. The Bank of Canada has noted that household spending on major purchases (things like cars and homes) has been soft, mainly as households cut back to deal with higher interest rates and some key prices (like shelter and food). But, retail spending surprised on the upside in the Fall and into the holiday season. Remember monetary policy is supposed to work to bring alignment of supply and demand by, in part, encouraging consumers to forego spending. When consumers don’t spend all of their income, our National Accounts data treats that as household saving. So, again, given the divergent trends in wages, what’s happening on spending and saving? Have lower income Canadians been able to build up the kinds of nest eggs their American neighbours have? In short, no.
Source: Author’s calculations using Statistics Canada Tables 36-10-0587-01 and 36-10-0662-01
Like the story on wages, we see a real difference by household income level. Households at all income levels are cutting back on their spending, but the cuts are deepest among those with the least slack to start with. The highest income households have cut back a bit but are really just back to their pre-pandemic levels of spending. Many observers have wondered how long it might take Canadians to use up excess savings accumulated during the pandemic. Other smart observers have wondered whether higher household savings rates reflect some underlying pessimism, as households try to build-up some cushion against a potential future downturn. But the households doing the saving or sitting on big savings aren’t the same households that seem worried they’re about to lose their jobs. We have savers and we have worriers, but they don’t seem to live together. Instead, lower and modest income households, despite cutting way back on spending, have negative savings. Even during the pandemic, they weren’t able to build up savings, they just had somewhat less debt. While the chart above looks at the rate of change over time, the underlying household average values might be more illustrative: Households in the bottom 40% started the pandemic with an average of $22,000 in new debt and ended it with an average of $21,000 in 2022. A modest improvement. If the 2023 trends hold, they’ll finish the year with an average of $25,000 in new debt. A definite decline in their financial stability or ability to weather a shock – like being laid off (as they worry they might), or more supply-chain disruptions in an increasingly volatile international environment.
In short, no Canada’s story has not been quite the same as the U.S.’s. The redistributive effects of a tight labour market haven’t taken hold here like they did in the U.S. Our headline numbers on inflation and unemployment are pretty good but below the surface, things are far more nuanced. The Bank of Canada knows this and says it tries to take account of household differences in spending, income and borrowing when they set their monetary policy. But at the end of the day, the Bank’s policy rate has to be the same for all of us. This is where fiscal policy can still play a role, in more targeted measures that can better respond to household differences in the messiness of bringing inflation down. We don’t need the kind of helicopter money that many provinces rolled out in 2022, but there is a policy space for fiscal action here. So, if the next federal budget has some thoughtful, targeted measures aimed at helping lower and modest income households, I for one won’t set my hair on fire.
. . .
ABOUT THE AUTHOR:
Jennifer Robson - Jennifer is Program Director and Associate Professor of Political Management at Carleton University where she teaches in Public Policy and Research Methods. Prior to joining Carleton, Jennifer Robson was director of policy for the non-profit SEDI (now Prosper Canada) and worked in the federal public service. Between 1994 and 2000, she worked in several political (exempt staff) roles. Her primary areas of research are at the intersection of household finances, particularly for lower and modest-income people, and the design and implementation of public programs including tax policy, financial capability and financial services, income security and household liquid savings. Jennifer holds a BA Hon. Psychology (Ottawa), MA Political Science (Carleton), and Ph.D. Public Policy (Carleton).
The views and opinions expressed are those of the author and do not necessarily reflect the position of Air Quotes Media. Read more opinion contributions via QUOTES from Air Quotes Media.